
Water Matters 2024

Household customers’ views of their water and sewerage services
Our annual Water Matters survey tracks the views of household customers on the services they receive from water companies in England and Wales.
Foreword
Our Water Matters survey is now in its thirteenth year, giving us invaluable insight into household customers’ views and preferences on water companies’ services across England and Wales. This makes it one of the most comprehensive records of customer views and preferences on any utility.
For many years, there was often little change between the figures, year-on-year. When there were shifts in opinion, these tended to be one-off instances and they had a low impact on the long-term trends1
However in recent years we have noticed steadily declining scores across a number of key performance indicators. In last year’s Highlights report, we warned that we were seeing signs of ‘an erosion of sentiment which, if left unchecked, could be very damaging to customers’ perceptions of water companies’. This has been thoroughly borne out by these latest findings.
We have seen significant2 shifts across nearly every metric that we use to measure people’s views. In many cases, these were the lowest scores recorded in the thirteen years of Water Matters. All companies had their lowest ever score for customer trust. The context of this report is continued concerns about the cost of living as well as sustained public exposure and scrutiny of water companies’ performance, especially in relation to the environment.
Later this year, Ofwat will set the level of water bills for the next five years. As the companies prepare to deliver their services over this period, it is vital that CCW – and, indeed the wider sector – listen to what people are telling us about what they want from their water companies. So, for this year’s report, we have pulled out the three key learnings from the survey results to tell the wider story of the data.
It is not all bad news. More people are aware of the schemes available to help reduce the bills of low-income groups, known as social tariffs. There is also growing awareness of WaterSure and WaterSure Wales, a tariff for people on benefits who use a lot of water for medical reasons or because they have a large number of children. Similarly, more people have heard about water companies’ priority services registers. These offer extra advice or support to people who need additional help in particular circumstances.
However, it’s clear water companies now have to do more than ever to try and stop the decline in people’s satisfaction and trust. Only then can they begin to turn these into positive trends. They will have to improve how they focus on the customer’s experience, share best practice for delivering services, and understand what is driving complaints so they can tackle the root causes. Ultimately consumers must notice a positive difference in the quality of the services and support they receive from their water company if their perceptions are to change.
1 The Water Matters survey has been running for thirteen years. However, for ease of reference and relevancy of data, we have chosen to illustrate only the previous 10 years of data in any graph. Where we talk of long-term trends, these refer to the trends observed in data collected in the last 10 years.
2 The statistical significance of a change will depend on the number of people who answer the question and the magnitude of the change. Smaller changes will be significant if the changes are based on a large number of respondents but not significant if changes are based on a small number of responses. Unless we state otherwise, all comparable figures in the text are statistically significant. Information about the statistical significance of data in graphs will be provided on request.

Jenny Suggate, Director of Policy, Research and Campaigns
Three key learnings from Water Matters
When we looked at the figures from our latest survey, which was mostly carried out in the latter half of 2023, we decided to focus on three standout key learnings. We have set these out below. Together these tell the story of the latest results: significant drops in customer trust to their lowest level, which mirror a fall in scores more widely in customer satisfaction, whether with value for money or company performance – especially in relation to environmental performance.
We will publish a small number of additional insight summaries, focusing on issues not covered in this Highlights report, during the year. The full results are set out in our data report and summarised at Appendix A (pdf).
Since we began this survey thirteen years ago, the average trust score has varied between 7.21 and 7.87 out of 10. This has now fallen to 6.37. This is the lowest score ever recorded and the largest fall in a single year. All individual company trust scores are also the lowest they’ve been since the survey began. This is also the first time that the trust score for water companies has fallen below that of energy companies.
We saw record low scores across the board when it came to different levels of customer satisfaction, but in particular all of the issues that relate to the environment saw the largest falls in satisfaction. This is perhaps unsurprising given the extent of media coverage and wider public anger around sewage pollution in rivers and streams. The largest single decrease from the previous year on customer satisfaction was for sewerage services when it came to cleaning waste water – down from 53% to 35%. Just 33% of customers were satisfied with what their company did to protect the environment, down from 45%.
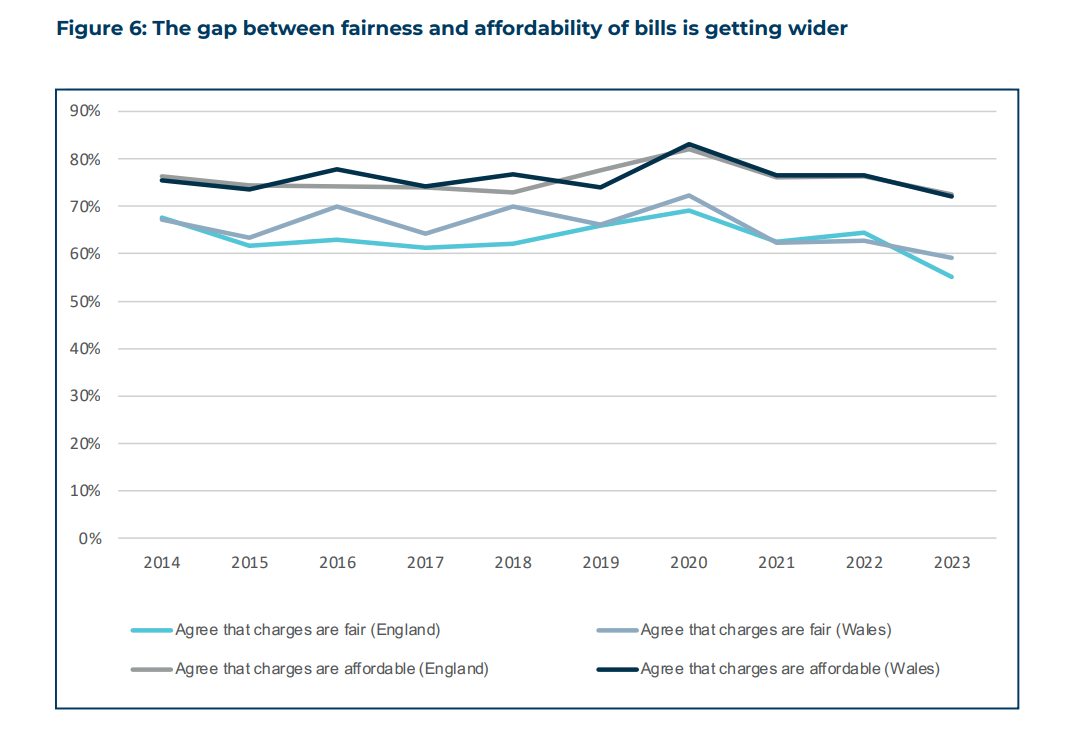
The number of customers who felt their bills were fair fell from 64% to 55%. There was also a drop in the number of customers finding bills affordable – down from 76% to 72%. This marked the widest divergence between these figures since we started to measure them, suggesting that it is not just views on affordability that can affect a customer’s perception on the fairness of charges.
Customer trust in water companies
The latest UK Customer Satisfaction Index, published earlier this year, showed the need for water companies to learn from other sectors in terms of building trust, with water companies scoring significantly lower on ethics and trust metrics than the UK average across all sectors.
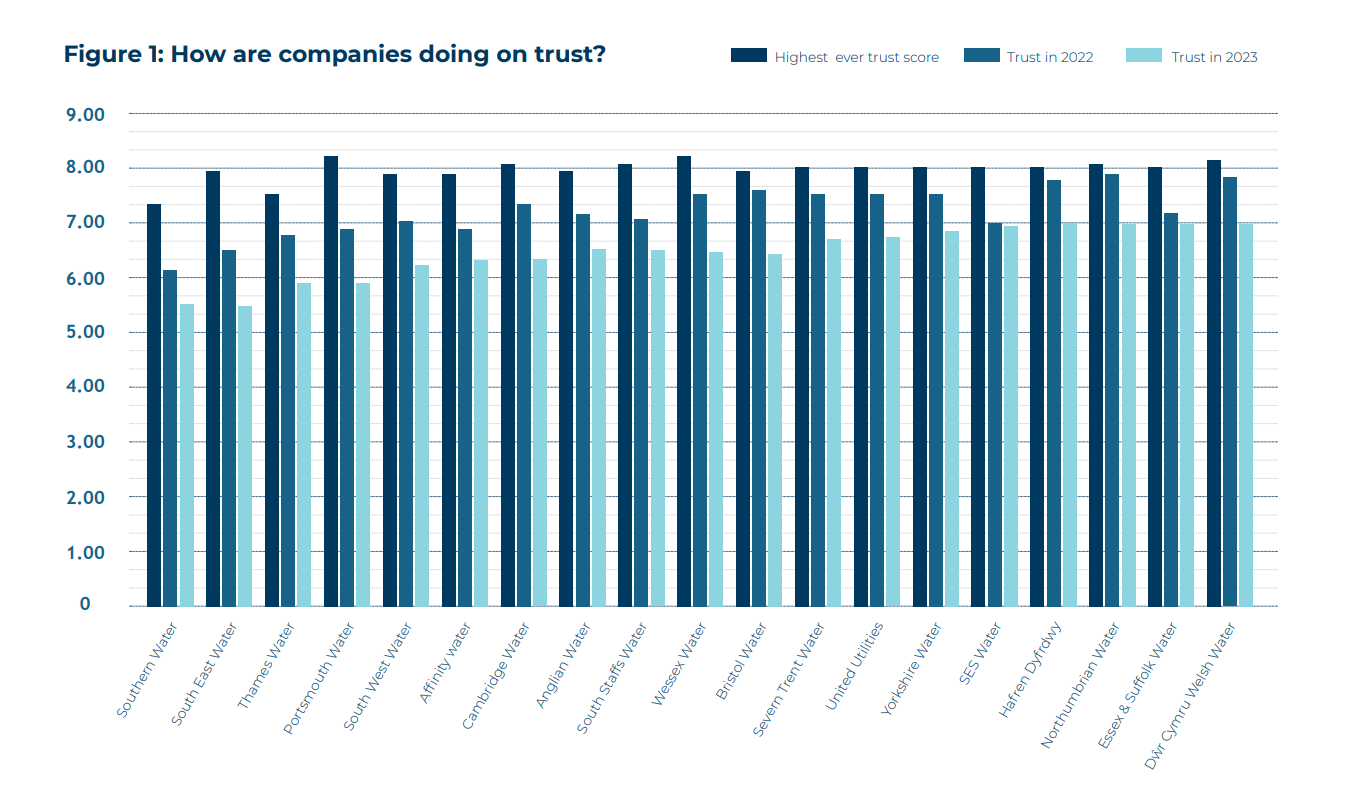
It should come as no surprise, then, that in our latest Water Matters survey, when asked, to give a score out of 10 for how much they trust their water/sewerage company, only 36% of customers gave an 8 or higher, down from 53% last year3. Across all companies their scores were the lowest ever. Across the last ten years, the average score for England and Wales is 7.49, compared to this year’s average score of 6.37.
Figure 1 looks at what companies scored this year, in comparison to the previous survey and the company’s highest ever scores (although this might have been in different years for each company).
3 When it comes to trust, ‘neutral’ is measured as someone scoring between 5-7; ‘trust’ is a score of 8-10, and ‘don’t trust’ is from 1-4.
View enlarged figure 1 graph (png)
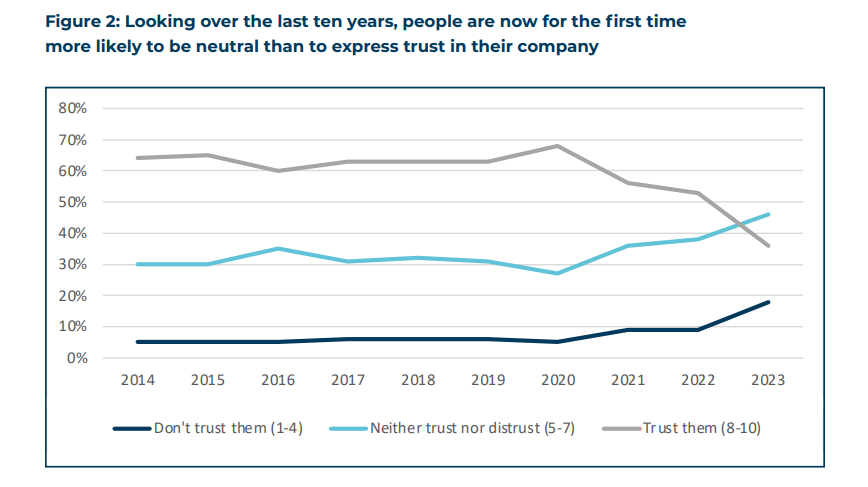
In recent years, our surveys have shown that those who once strongly trusted their company gradually became more and more neutral, with customers increasingly less likely to give a trust score of between 8-10. This now neutral cohort is becoming increasingly less trustful, making it much harder for companies to rebuild their trust and improve the picture.
View enlarged figure 2 graph (png)
Figure 1 shows that, generally, the lowest scores – and biggest reduction from their highest scores – are for those companies in the south east of the country.
Over the past few years there have been a considerable amount of media coverage of some water companies’ poor performance, particularly in relation to storm overflows and other pollution incidents.
Water Matters results that directly relate to environmental issues have seen some of the largest falls in customer perceptions. We look at this further in the next section.
Satisfaction with performance – especially in relation to the environment
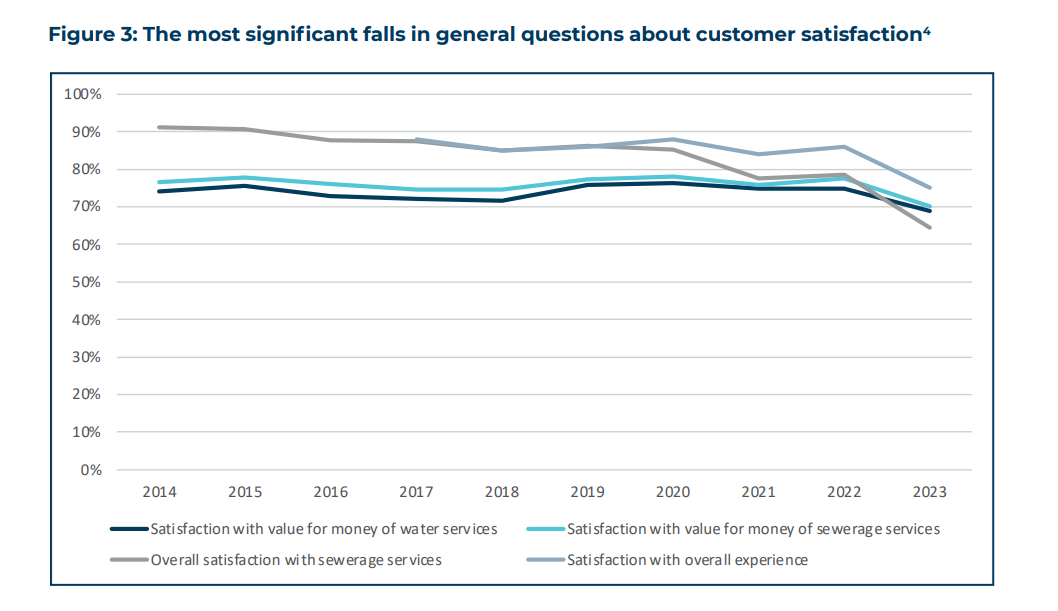
As mentioned in the introduction, customer satisfaction has fallen across all areas where it is measured. In this section, we highlight those issues where overall satisfaction has fallen by more than 5% in the tables below. When we look at these results more closely, we can see that the biggest falls are for the results relating to issues that have a direct impact on the environment.
View enlarged figure 3 graph (png)
By way of comparison, the overall satisfaction with water services fell by 3%, from 92% to 89% on average across England and Wales.
People were also asked about their perceptions of elements of both their water and sewerage services.
Two of the elements of the sewerage services that they were asked relate to issues that have a direct impact on the environment, alongside a general question about how people perceive companies protect the environment. We look at these next.
4 ‘Satisfaction with overall experience’ measurement was only introduced in 2017.
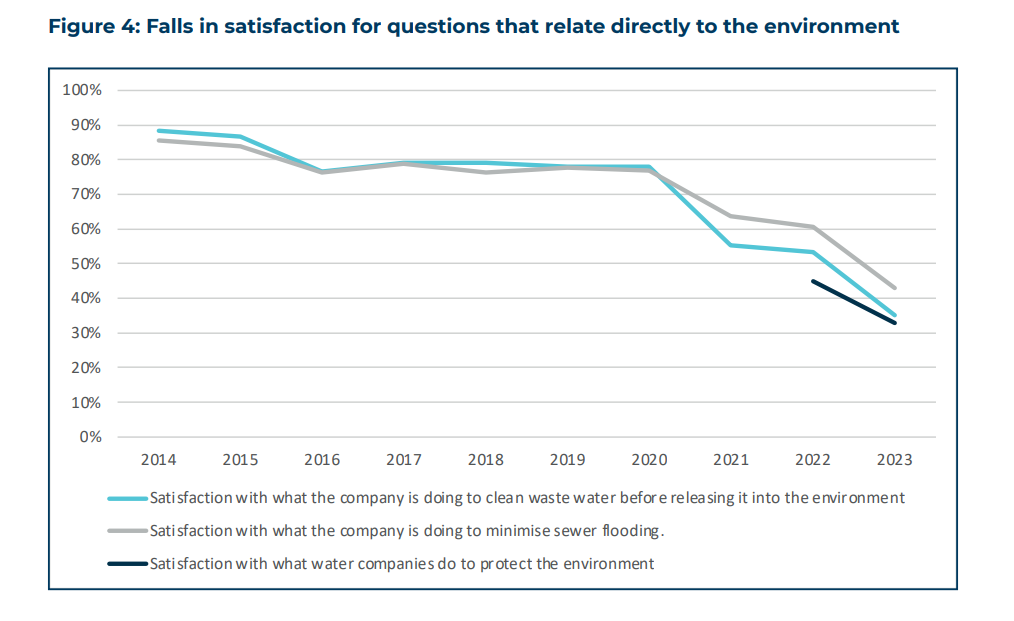
View enlarged figure 4 graph (png)
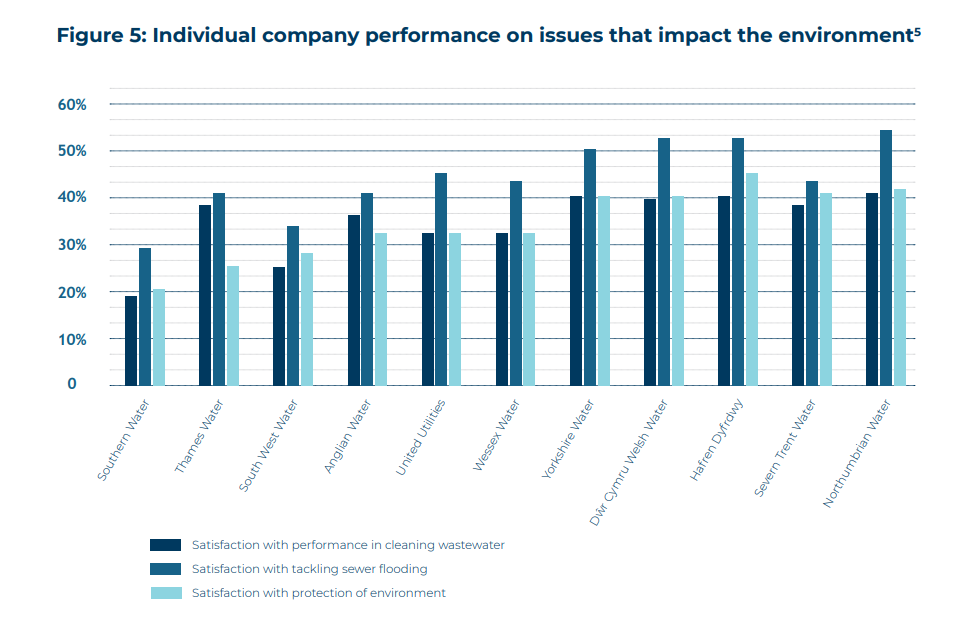
View enlarged figure 5 graph (png)
5 Customers of WoCs who receive sewerage services from nearest WASC also show a similar pattern of responses.
Once again, the data shows that satisfaction in the three areas shown is generally lower in areas of the South East of England but the picture is still negative elsewhere. The company with the highest score – Northumbrian Water – still only saw 43% of its customers say they were satisfied with what the company was doing to protect the environment.
We have only been asking the question about how well people think their companies are protecting the environment for two years. We also ask people for the reasons behind their answers. When we first asked this, the single most common response was ‘too much pollution/sewage is put into water’, with a quarter of respondents citing this issue. This time 40% of survey respondents gave this as their reason – as many as the next six most common reasons combined.
What some people who were dissatisfied had to say:
I have seen it on the news where a lot of water companies are polluting the sea and rivers and it isn’t helping anybody.
What I hear in the media, constantly bombarded about sewage being released into rivers. Sewage works are outdated and Victorian.
Because of the pollution into rivers and seas, there should be an overhaul and reinvestment.
Affordability and fairness
Affordability is a key issue, especially in the context of an ongoing cost of living crisis. One of the stand-out findings from the previous year’s survey was the sharp rise – 53%, up from 34% – in the proportion of customers saying that their household financial situation had become either ‘slightly’ or ‘significantly worse’ in the last twelve months.
From that low bar, this year’s results gave little grounds for renewed confidence – 48% said their situation was worse still.
Unsurprisingly, then, the proportion of customers who agreed that their bill was affordable dropped from 76% to 72%. However, the striking fact of this year’s findings is that there was twice as large a decline in those who thought their bill was fair, down to 55% from 64%.
In every year of Water Matters results, people have been more likely to think their water bill is affordable than fair, with the difference between the overall averages each year being between 8% and 13%.
This year, however, the gap has reached its widest ever level of 17%. One possible explanation of this is that the collapse in trust that we have been seeing over the past year has filtered into a stronger feeling around the fairness (or unfairness) of bills.
Certainly customers of the companies with low trust scores, such as Southern Water, Thames Water and South West Water, were also among the least likely to agree their charges were fair.
Regional variation – some better news
So far, in this report, we have focussed on a core of results where most companies saw a decline in their performance.
However performance has varied considerably across England and Wales and there have been some better results for companies, chiefly in the area of customer engagement. This is important because, during a time of greater financial uncertainty, the companies need to be accessible to customers and responsive to their needs, especially if these change.
Of the nineteen companies for which we have data, eight saw an increase in the proportion of people who contacted their company saying they were satisfied with the ease of contact. Seven saw an increase on the previous year in the proportion of people who contacted them saying they were confident that their issue would be resolved: Northumbrian Water, for instance, recorded a 15% increase on the previous year, with all 100% of respondents saying they were confident that their issue would be resolved.6
Overall across England and Wales, though, for these two metrics there was a 1% and 2% fall from the previous year, respectively to the lowest recorded scores. This serves as a reminder that overall trends can obscure where some companies are beginning to make progress in reversing poor performance.
More people (25%) than ever before said that they had contacted their company in the past twelve months, so making sure people get a good response to their issue is vital. It would be better if people didn’t need to complain in the first place. We don’t think water companies will focus on getting the basics right for customers until Ofwat includes the volume of complaints as a measure in its customer experience score (C-Mex). C-Mex gives companies a financial incentive if they do well at providing the customer with an excellent customer experience.
6 It should be caveated that, for Water Matters, when it comes down to the number of customers of each individual company who have contacted their company, the sample size can be quite small.
Conclusion
These highlights tell the story of how household customers’ views have changed since last year’s report. The story that has emerged is the significant – and accelerating – decline in customer trust, and how this relates to lower satisfaction, particularly around dealing with waste water. There is also a rising sense that bills are unfair, driven by customers’ declining trust in companies.
In the first instance, water companies need to focus on rebuilding this trust if they are to have a chance of halting these steepening trends. And they need to begin by addressing how people view their performance on the environment.
It is not surprising, given the increased public exposure of water pollution incidents over the past year, that the biggest falls in scores were those relating to environmental performance. There is a pressing need for companies to do more to explain what they are already doing to reduce sewage pollution and protect the environment. However, it is important to acknowledge where certain companies are getting things right, as well as holding them to account when they get things wrong. As noted above, at a regional level, some companies are improving their scores when it comes to dealing with customer contact, although the overall trend across England and Wales was a downwards one. This was due largely to a few notably poor performers. There is much further to go, but the picture in England and Wales as a whole is sometimes disguising where progress is being made at an individual company level.
Companies are also working with us on a number of areas, such as improving the payments that they make to customers if they fail to meet statutory service standards. It is also positive that water companies are actively engaging with customers about the financial support that is available if people struggle financially. With prices set to rise significantly over the next five years it’s vital that companies focus on ending water poverty as one driver of rebuilding trust.
However, this could all be for nothing if companies cannot show customers that they are improving their environmental performance. This year’s report suggests that the decline in trust may already have reached a tipping point, beyond which it will only get harder for companies to simply stop the decline in customers’ perceptions, let alone try to reverse them.
Companies are often reluctant to share information with each other, as they feel they are in competition for regulatory incentives. However, it will take a huge effort to address the issues outlined in this report so companies need to consider how they can tackle these challenges in a fresh way. Sharing best practice is a start that could lead to making the most of opportunities to innovate in a way that would benefit the whole industry, and this is something CCW is pushing for as part of its campaign to bring about a customer-centric culture.
Ofwat will deliver its final decisions on its five-year price review in December. After that it will be over to the companies to show how they can deliver their investment plans over 2025-30. To increase trust, companies need to tell people what they are doing with their money to improve services and – just as crucially – deliver their plans so that people experience and notice a difference.
Key highlights are below but the full set of results is in our data report (pdf)
Trust
- The average trust score (out of 10) in England and Wales across the last thirteen years is 7.49 and there has been relatively little movement on this, until this year – when it dropped to 6.37. This is the lowest score yet recorded, as well as the largest fall in a single year.
- England vs Wales: the individual trust scores for England (6.34) and Wales (6.93) were both respectively the lowest yet seen. However, it is worth noting that this represents a significant difference between England and Wales, with the largest gap between the two trust scores since Water Matters began.
- There was also a lot of variation between individual company scores for trust. At one level, Dŵr Cymru Welsh Water and Essex and Suffolk Water scored relatively well (6.94 and 6.93 respectively), while at the other, Southern Water and South East Water scored only 5.44 and 5.49, respectively.
- This is the first time a company trust score has been less than 6 out of 10.
- This is also the widest variation in scores between companies yet recorded.
- Most significantly, despite this wide variation, every single company trust score was at its lowest recorded level – even those that did relatively well, like Dŵr Cymru Welsh Water.
- At the same time, we also saw a fall in people agreeing that their company cared about the service it provided: we saw a 14% drop from last year’s Water Matters, from 64% to of people agreeing with this statement – by far the lowest recorded score since the beginning of Water Matters in 2011.
- We saw the same downwards trend in the figures for customer satisfaction with different aspects of the quality of their water supply – with the lowest recorded score across six different metrics:
- Reliability of water supply – net satisfaction still fairly high at 94%, though this has been creeping downwards since 2020
- Colour and appearance of tap water – net satisfaction 91%
- Safety of drinking water – down to 88%, the first time it has dipped below 90%. This is gauging people’s perceptions of the safety of tap water, and echoes emerging views that we saw in our Understanding Customer Priorities. Tap water in the UK is treated to some of the strictest levels in the world and passes over 99.95% of tests.
- Water pressure – down to 85%, from 88%.
- Taste and smell of tap water – down to 84%, continuing a downward trend from 88% in 2020.
- Hardness/softness of water – this has seen the biggest fall in satisfaction over the past decade, from 76% in 2014 to just 60% this year.
- Satisfaction with various aspects of sewerage services fell even more significantly, ranging from 59% for reducing smells and maintaining pipes to just 35% for cleaning waste water.
- While we have seen a less severe decline in satisfaction when it comes specifically to bills compared to other metrics, this year nevertheless saw the lowest recorded score for satisfaction with value for money of water and sewerage services.
- We surveyed awareness of a range of financial support measures. Awareness of all of these had risen, to the highest recorded level since Water Matters began, with a significant rise from the previous year:
- In England, awareness of WaterSure tariffs rose by 5% to 17%; in Wales, there was a 7% increase to 19%.
- Across England and Wales, there was an 8% rise in awareness of water companies’ offers of reduced bills to 45%.
- We also saw a 3% increase in awareness of Priority Services offered by companies – this is now at 50%.
- More people said they had contacted their company in the last 12 months than ever before – 25%, across England and Wales. The most common issues are billing enquiries, reporting a leak and sewerage problems. The proportion of those people across England and Wales who were satisfied with the ease of contacting was 77% – our lowest recorded score.
- We also saw a decrease, from 51% to 47%, in customers who thought their company communicated well on services and plans. Communicating well on performance and plans will be part of the focus companies need to have to rebuild trust.
- Our 2023 report showed that fewer people than ever were satisfied with what their water company does to protect the environment (only 45% of people agreed). This year, the downward trend continued: just a third of people (33%) said they were satisfied.
- Confidence that longer-term water supply will be available without restriction fell again, from 63% last year to 59% this year.
- When it came to value for money, we also saw the lowest ever proportion of people agreeing that water and/or sewerage charges were affordable (72%) and fair (55%). Additionally, 48% of people said that their household financial situation was either slightly or significantly worse than last year.
- This year the number of customers who find their charges affordable is 72% (down from 76%), which is 17% higher than those who find their charges fair, at 55% (down from 64%).
- While there have been drops in performance for both England and Wales, scores in Wales remain typically higher – in many cases significantly higher – than in England.